

 Available in US
Content
- Triangulating the Round in Sixty Seconds
- The Framework I Run Every Tournament Morning
- Strokes Gained: The Spine of a Live Read
- Course Fit and Why History Lies in Different Ways at Different Venues
- Weather as a Live Signal
- Field Strength, Bias and the Distance Floor
- Bankroll and Stake Sizing on a Four-Day Card
- Model Versus Narrative
- How I Actually Detect Value in a Round
- Common Mistakes That Eat the Bankroll
- Quick answers on live golf strategy mechanics
Triangulating the Round in Sixty Seconds
A live golf strategy is not a player pick. It is a process that runs on a tight clock, takes three input streams in parallel, and produces a stake-sizing decision before the next tee shot. Between the moment a putt drops on one green and the moment the next group strikes from the following tee, you have something like sixty to ninety seconds to read what just happened, compare it to what the book has done with the price, and decide whether to act. That is the entire window. If your read involves opening a spreadsheet, you are too slow.
The framework I have settled on after seven years of trading these markets runs three streams: Strokes Gained data on the player relative to the field, course-fit signals against historical patterns, and a real-time weather and field-strength read. The three inputs triangulate. A player gaining on approach, on a course where approach has been the leading signal across recent winners, in a weather window favourable to ball-flight control — that is a thesis. A player with one of those three on his side is a hunch. A player with none of them is the kind of stake that drains accounts.
Pamela Maldonado, the sports betting analyst at ESPN, wrote a line about golf betting that I have pinned to my desk: “Golf betting is a slow-burn panic. Throwing darts at the board and hoping for a bullseye is a good way to run out of funds before the weekend. And if you’re putting the same amount on everything, stop right now — that’s the equivalent of using a putter from the fairway.” That is the framework’s mood. Strategy is not enthusiasm; it is selection. What follows is the version of it I run every Thursday morning.

The Framework I Run Every Tournament Morning
The global sports-betting market is forecast to climb from $108.92 billion in 2024 to $198.53 billion by 2030, with live and in-play singled out as one of the key growth segments. Most of that volume is football and basketball. The golf share is small in relative terms, but the in-play product on golf is one of the structurally richest in the entire market — and that structural richness is where a data-led framework earns its keep against the noise.
The framework has four steps. Before the first tee shot of the tournament: course read, field read, weather forecast for all four rounds. Between the first and the last tee shot: live data on Strokes Gained per round, projected cut line in real time, and weather rolling. Between holes during play: a single question — has the book absorbed the news, or has it not. After settlement: a written note on every stake placed, win or lose, with the reason.
The last step is the one that turns the framework from a process into a discipline. I keep notes on every live golf stake going back roughly six years. The single most useful pattern from that log is the one that took me longest to admit: stakes placed within five minutes of a televised event — a leader bogey, a chip-in, a putt to take the lead — lose at a materially higher rate than stakes placed in the cleaner middle of a between-holes window. The lesson is that emotional reaction time and rational reaction time are not the same thing, and a framework exists to slow the first one down.
Strokes Gained: The Spine of a Live Read
Strokes Gained is the spine of any modern golf read, and if you do not have it in your head you are betting blind. The concept is simpler than the name suggests: for every shot a player hits, the metric measures how that shot performed compared to the PGA Tour average from the same starting position. A player whose Strokes Gained: Approach is +1.5 per round is gaining one and a half shots per round on the field through his iron play alone. Sum that across a 72-hole tournament and you have a structural six-shot advantage from one category.
Scottie Scheffler in 2025 led the PGA Tour in Strokes Gained: Approach, Strokes Gained: Tee-to-Green and Greens in Regulation simultaneously. His birdie-or-better rate hit 25.78% — more than one in four holes ended in a birdie or better. That is a structural compounder. Every category he leads adds shots to his round; every additional shot moves him up the leaderboard; every position higher on the leaderboard tightens his outright price further on the in-play market. The book knows this. The market is priced as if Scheffler is the favourite at every event he enters, and on most of them that price is actually short of his true probability.
For live betting specifically, Strokes Gained: Approach is the metric I trust most. It updates fastest, it correlates strongest with single-round outcomes, and it is the metric most sensitive to course-fit signals. A player who has been gaining on approach all season, arriving at a venue that rewards approach play, is a strong live thesis from the first shot of the tournament. If you want the full breakdown — how Approach data compounds across rounds, which courses suppress its signal, and how to translate Strokes Gained into a stake size — I have written out how Strokes Gained: Approach reads on a live card as a dedicated piece.
The complementary metric is Strokes Gained: Putting, but I treat it with more caution. Putting is the most volatile sub-category of the four, and a hot putting week is the single least repeatable thing in golf. A live putting-driven price move should be discounted before it is acted on.
Course Fit and Why History Lies in Different Ways at Different Venues
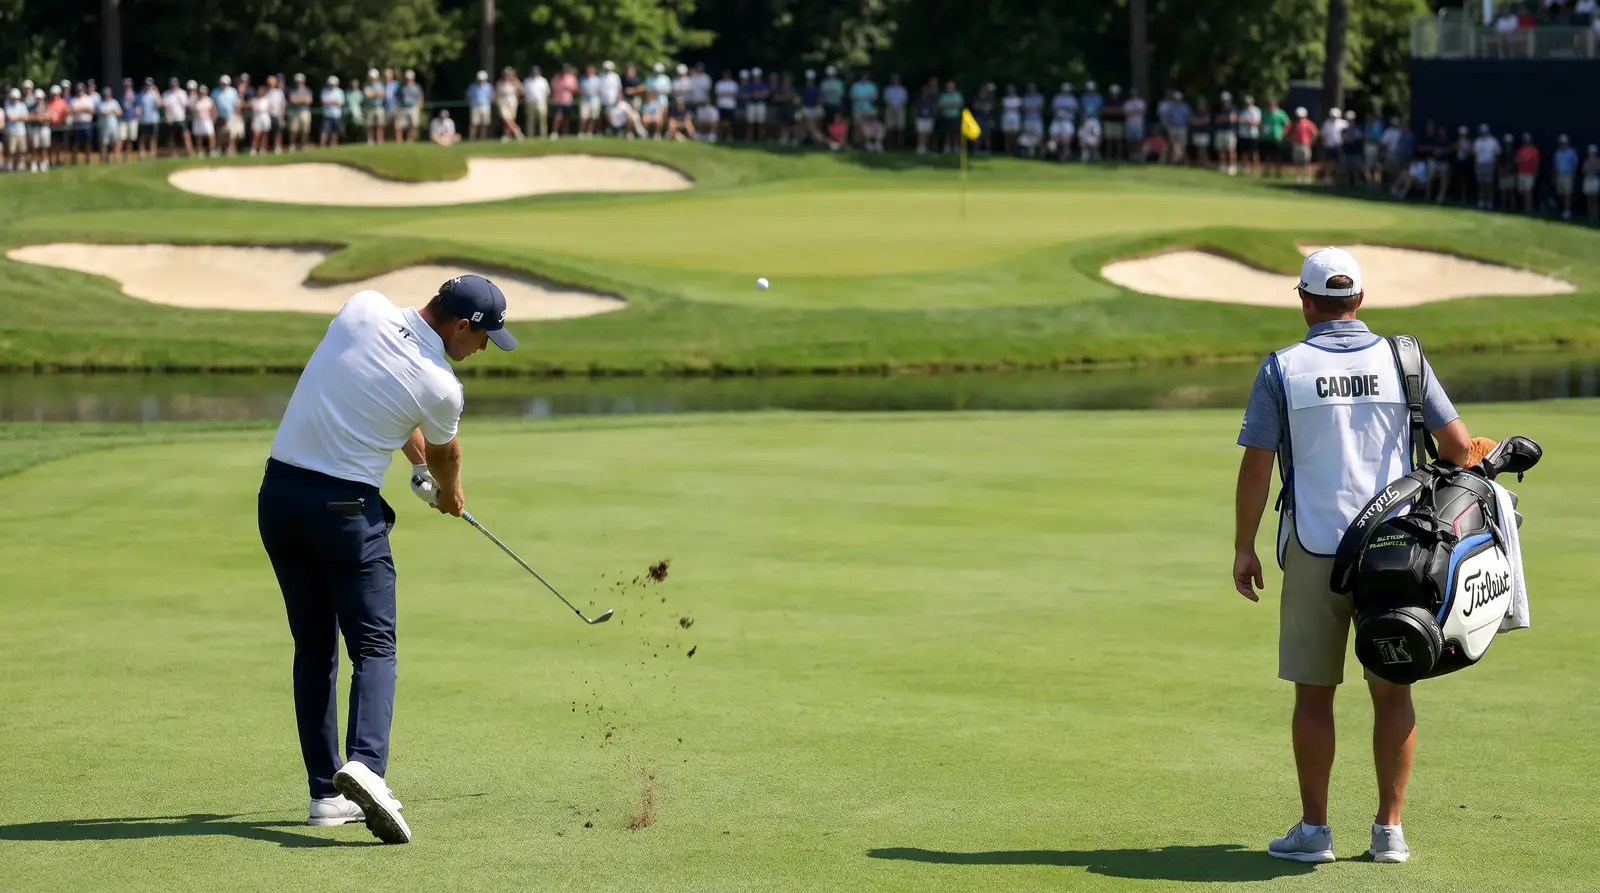
Course fit is the input that most beginners overweight and most veterans never trust completely. The idea is simple: certain courses reward certain skill profiles, and a player whose game matches the venue should be priced accordingly. Augusta rewards a high draw off the tee and a strong short game; Pinehurst rewards approach play into firm crowned greens; a links course in July rewards trajectory control and creativity.
The problem is that course-history data lies in different ways at different venues. At Augusta, the same field returns every year and historical results carry signal — players who have made cuts there tend to make cuts there. At an open-field PGA Tour event with rotating venues, the historical sample on most players is too small to be statistically meaningful. The pattern I have settled on: at the four majors and at the established Tour stops with consistent venues, I weight course history at roughly 25% of the live read. At new venues or low-sample fields, I weight it at near zero.

The trade-off here is between recency bias and structural fit. A player who has played a course five times in the last six years and finished in the top twenty four of those times is telling you something real about course fit. A player who finished second at a venue eight years ago and has not played it since is telling you almost nothing. The live market often does not distinguish between those two cases; the in-play outright price on a player with the second profile will sometimes shorten on a good first round purely because of name recognition and historical association. That misprice is one of the consistent edges in major-week live trading.
Weather as a Live Signal
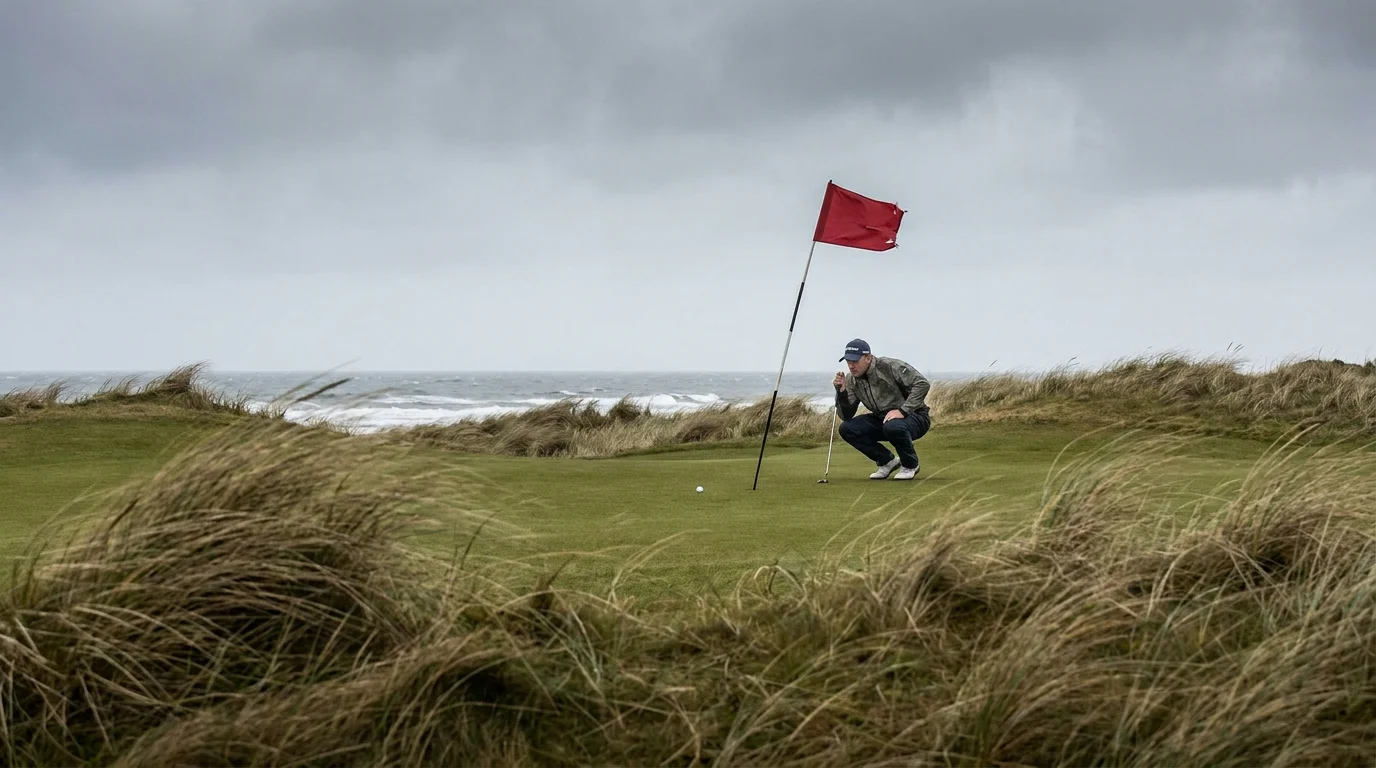
Weather is the live signal that pays for itself faster than any other. The reason is simple: weather moves continuously, the book updates in discrete steps, and the gap between continuous truth and discrete pricing is where the trades live. A wind forecast that revises from twelve miles per hour to eighteen miles per hour at 9am for an 11am tee time will not show up in live outright prices for thirty to forty-five minutes — and by the time it does, the morning wave is already on the third hole.
The variables that move prices, in order of impact: wind speed and direction, which affect ball flight and putting; rain, which softens greens and rewards aggressive approach play; temperature, which affects ball compression and carry distance; and occasionally fog or lightning, which suspend play entirely. Each one of these has a different lag between forecast revision and market reaction. Wind moves fastest; temperature moves slowest, almost imperceptibly across a round.
The trade I make most often around weather is the cross-wave matchup. When the morning and afternoon waves of a Thursday or Friday round draw materially different conditions — a still morning followed by a windy afternoon, for example — the book takes time to update the head-to-head matchups for players in the harder wave. The forty-five-minute window between when the forecast revises and when the prices catch up is where the work happens.
Field Strength, Bias and the Distance Floor
Field strength is a structural input most live bettors ignore. The strength of the field at a regular DP World Tour event is materially lower than at a major; the in-play prices on the favourites at a weaker event imply a probability that is sometimes too low because the book is calibrating against a stronger field than is actually present. A 25% implied probability on the world number eight at a thin DP World Tour event is sometimes a real edge; the same 25% on the same player at a major is more likely fair.
The other structural input I track is the distance floor. The PGA Tour driving distance average in 2025 sat at 303 to 304 yards, with leaders like Aldrich Potgieter at 327 yards or more, and the touring average has been climbing five to seven yards year on year. That trend matters for two reasons. First, courses that were designed twenty years ago are playing materially shorter to today’s longest hitters, and the in-play markets at those venues consistently underprice the long bombers. Second, the gap between the longest hitters and the touring average is itself widening — which means at courses with reachable par-5s and long par-4s, the distance edge translates more directly into Strokes Gained: Off-the-Tee, and from there into outright price.
The bias I track most consistently is the morning-wave bias on links courses in summer. Mornings on a links in July often play under benign conditions; afternoons play under wind. The live outright market knows this in theory and prices it imperfectly in practice, partly because the morning-wave players are still on the course when the afternoon wave starts. Identifying which days carry the strongest cross-wave bias, and which players are drawing into which wave, is a structural edge that does not disappear.

Bankroll and Stake Sizing on a Four-Day Card
The single most expensive mistake I see live golf bettors make is flat-staking across markets with materially different margins. If you are putting £20 on a live outright that carries a 5% book margin and £20 on a hole-in-one special that carries a 20% margin, you are subsidising the second with the edge from the first. Stake sizing has to track market margin or the long-run maths punishes you regardless of how good your reads are.
My own approach is a modified Kelly fraction, capped at 25% of full Kelly on any single stake and reduced further on legs with high variance. For most live golf positions I size between 0.5% and 2% of the working bankroll, with the largest stakes reserved for live outrights on legitimate contenders where my edge calculation shows at least a 3% gap between my fair price and the book’s price. Three per cent is the threshold below which I do not act, because the book’s own margin plus my model uncertainty makes the edge too thin to survive variance.
The Maldonado line I quoted in the intro lands here as well: putting the same amount on everything is the equivalent of using a putter from the fairway. The point is not to bet less — it is to bet differently across markets, with sizing that respects the margin and the variance of each one. A bet sized for a 5% market is a wrong bet in a 20% market, and vice versa.
The four-day structure of golf makes bankroll management harder than it looks. A tournament has roughly seventy individual decision points where a meaningful price moves — about seventeen between-holes intervals per round multiplied by four rounds — and a disciplined bettor will not act on most of them. The discipline is in not betting, not in betting. Roughly five to ten staked positions across a major week is my normal range. Anyone running thirty or more is trading enthusiasm, not edge.

Model Versus Narrative
The hardest part of a data-led live golf strategy is not the data. It is ignoring the broadcast narrative when the model disagrees with it. Mark Darbon, the R&A chief executive, made an observation about the wider sport that maps directly onto the betting product: “Golf is in a strong position and these new figures show that participation continues to boom around the world, especially among younger audiences.” A growing audience means a growing live market, and a growing live market means more broadcast narratives, more storylines, more emotional capture in real time.
The narrative trap is specific. A player who has just made an eagle on a par-5 to take the lead with five holes to play is the most overpriced live contender on the entire card for the next ten minutes. The broadcast has just shown the eagle three times, the commentary team has called him the favourite, and the public money has shortened his outright price by as much as 30% on the back of a single event. The model has not moved nearly that much. The eagle was a known low-probability event with a known impact on the round, and a competent in-play model would have priced the post-eagle probability before the celebration finished.
The reverse case is the player who has just bogeyed the eighteenth to finish a round. He has not lost the tournament; he has lost one shot. The broadcast cuts to him walking off the green; the camera lingers; the price drifts wider than the model justifies. Ten minutes later the price normalises. Those ten minutes are an edge — small, repeatable, and dependent only on the discipline to act when the broadcast is loudest in the wrong direction.
How I Actually Detect Value in a Round
The process for detecting value in a live round runs against a single question, repeated every between-holes window: where has the book moved the price more or less than my model justifies. The answer is almost always specific. If the book has moved the price more than the model justifies — a leader’s outright shortening too quickly on a single hot hole — there is value on the field against that leader. If the book has moved the price less than the model justifies — a contender’s outright drifting only slightly on a structural problem like a hot putter going cold — there is value laying that contender.
The model itself does not have to be sophisticated to do this. I run a back-of-envelope in-play model that takes leaderboard position, Strokes Gained from the round so far, holes remaining, and a course-difficulty adjustment, and outputs an implied probability for the top-ten and top-twenty markets. That probability against the book’s implied probability is the entire trade decision. When the gap is more than 3% in my favour, I act. When it is anything less, I wait.
The disciplined version of this process never fires more than once per between-holes window. The undisciplined version fires three times, doubles down on a thesis that has not been tested by a second round, and then asks why the bankroll is down on a Sunday morning. The discipline is the strategy. The maths are just there to tell you when the discipline allows you to act.

Common Mistakes That Eat the Bankroll
The most common mistake I see, and that I have made plenty of times, is staking from the broadcast. The second most common is doubling stakes after a loss on the assumption that the variance has to even out — which it does, but not on the timescale that protects a bankroll. The third most common is treating live outright as a hedge against pre-tournament. Live outright is a different product, with a different price, and chasing your own pre-tournament stake with a live outright on the same player is paying double margin on a single thesis.
Wider context matters. The UK Gambling Survey for Great Britain methodology placed problem gambling at 2.7% of adults in 2024, with at-risk gambling at 3.1% and low-risk at 8.8%; the NHS Health Survey for England, using a different instrument, has the headline number at about 1%. The methodological gap matters less than the principle: if your live golf trading is starting to feel less like an analytical process and more like a search for the next stake, the framework has stopped working. Stop trading the week. Come back when the framework is the centre of the activity again, not the wrapper around it. Discipline is not a personality trait — it is the only edge that survives a bad streak.
Quick answers on live golf strategy mechanics
How quickly does a Strokes Gained: Approach edge translate into a live-odds move?
A meaningful single-round Strokes Gained: Approach number — say plus two or more relative to the field — typically shows up in outright and top-ten prices within two between-holes windows of the round closing. The book updates the model continuously, but published prices lag the model by anywhere from sixty seconds to four minutes depending on the operator.
What weather variables matter most for a live golf staking decision?
Wind speed and direction matter most, by some distance, because they affect ball flight, putting and approach club selection simultaneously. Rain matters next, mainly through green softening. Temperature matters least but is not zero, because ball compression and carry distance shift through a cold morning and a warm afternoon. Forecast revisions take roughly thirty to forty-five minutes to flow through to live outright prices, which is the working window for cross-wave matchup trades.
Should I size live golf bets by Kelly fraction or by flat stake on a four-day card?
A modified Kelly fraction beats flat-staking on a four-day card because market margins range from around 4% on outrights to 20% and above on props, and flat-staking subsidises the high-margin bets with edge from the low-margin ones. I cap individual stakes at 25% of full Kelly to control variance and only stake when my model shows a 3% or greater edge against the book.
