

 Available in US
Content
The Major That Asks a Different Question
The first US Open I covered seriously as a live punter was 2014 at Pinehurst. By Friday evening I had lost more on top-finish tickets than I had at the previous two majors combined, and I could not understand why. The players I had backed were ball-striking elite, putting well, and scoring near my model’s expected numbers. They were also finishing tied 25th, tied 38th, and tied 51st. The model knew the players. It did not know the US Open.

The US Open is the only major where scoring scales differently. At the Masters, the PGA, and The Open, a tour-average week of ball-striking translates to a tour-average finish. At the US Open, the USGA’s setup philosophy specifically punishes anything less than excellence, and the gap between elite and average is amplified in ways that destroy normal live-betting models.
Scottie Scheffler in 2025 led the PGA Tour in SG: Approach, SG: Tee-to-Green, Greens in Regulation, and a birdie-or-better rate of 25.78 per cent. That birdie rate is the highest single-metric number you see at the top of any tour. At a US Open, with rough thick enough to make second shots from off the fairway a true bogey-or-worse risk, even Scheffler’s birdie rate compresses by 30-40 per cent. The model has to know that the metric does not transfer at this venue.
USGA Setup Impact on Odds
The USGA’s setup ethos at the US Open is rooted in the original “Open” idea: par should be defended, and the winner should be the player who plays the cleanest tournament rather than the most aggressive one. Modern US Open setups achieve this through three specific levers: very thick primary rough (often 4 inches+), fairway widths narrower than tour standard, and green firmness that rewards precise iron play above all else.

The implication for live betting models is that the standard scoring distribution does not apply. SG: Approach is the metric that survives a US Open setup better than any other — players who can hit greens from 150-200 yards out under maximum demand are the ones who post sustainable rounds, while players who depend on scoring from off-the-fairway recovery shots collapse.
The live trading desks know this and adjust their models for US Open week. SG: Approach gets weighted 40-50 per cent higher than at a typical tour event; SG: Putting gets weighted similarly higher because the firm greens punish marginal putts; SG: Off-the-Tee gets weighted moderately because the fairway penalty is severe but distance matters less than at long-rough majors elsewhere.
The result is that pre-tournament prices on US Open-specific player profiles compress earlier than at other majors. A specialist in iron play and short-game touch (think the Geoff Ogilvy or Webb Simpson archetype) priced at 60/1 outright on a regular tour event might price at 40/1 for a US Open. The market knows what kind of player wins this tournament.
Even Par as Winning Score
The most distinctive feature of US Open live betting is that even par is often a winning score. At a normal PGA Tour event, the winner is at -15 to -20. At The Open, -15 to -20. At the Masters, -10 to -15. At the US Open, the winning score is frequently -4 to -10, and at the toughest setups (Shinnecock 2018, Winged Foot 2020), the winner came in at +6 and -6 respectively.
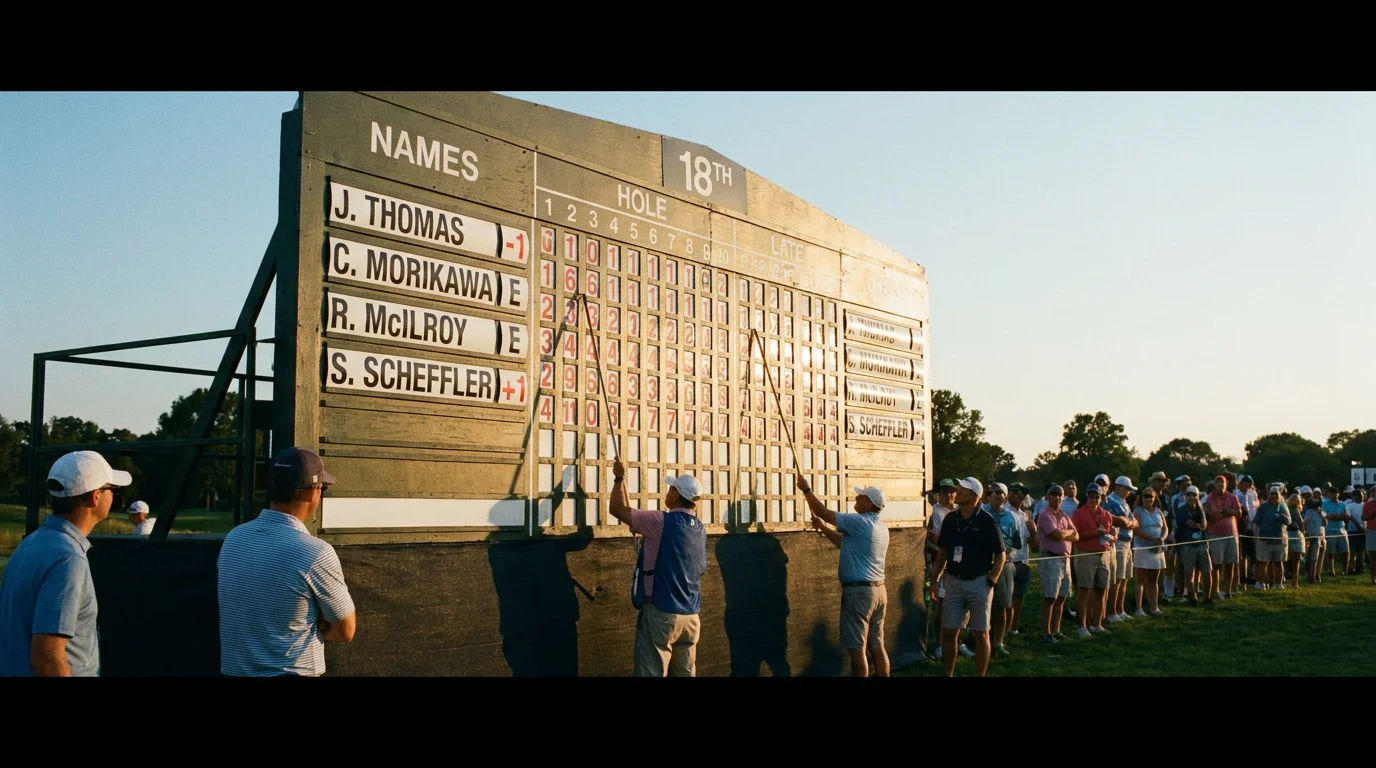
The live-betting consequence is that the model has to recalibrate what “leading” means. A player at -2 through 36 holes at a normal tour event would be priced around 80/1 to win outright. At the US Open under tough setup conditions, the same player at -2 might be the actual leader with implied probability of 20 per cent, priced at 4/1.
Why does an even-par leader at the US Open often hold longer odds than expected? Because the market over-anchors to “what a leader at -2 looks like at a normal event.” The public sees -2 through 36 holes and assumes “this isn’t really a leader, real leaders are at -10.” Live trading desks correct this aggressively, but the pre-public-side correction creates entry windows where the leader’s price is genuinely too long.
The flip case is the public chasing red figures into Sunday. A player at -6 on Saturday evening looks “more like a leader” than a player at -2, and the public-side money flows accordingly even when the model says -6 has only a marginal advantage over -2 because the next 18 holes will produce typical US Open scoring (over par on average for the field). The disciplined US Open punter resists this anchoring instinct.
Live Make-the-Cut at the US Open
Make-the-cut at the US Open is the most read-dependent of the four majors’ MTC markets. The cut at the US Open is “top 60 and ties” — tighter than the PGA’s 65, The Open’s 70, the Masters’ top 50 — and the cut line itself tends to land at higher numerical scores (e.g., +5, +7) than at the other majors.

The 2025 US Open setup conditions produced a cut line at +6, with 62 players surviving 36 holes. The live MTC market for borderline players in round two was the most active stretch of live golf trading on the calendar that week.
The pattern in my notes from recent US Opens: live MTC prices for players sitting around +5 mid-Friday are systematically too short. The reason is that the trading model assumes the cut line will land at the projected number from Friday morning’s scoring, but US Open afternoon scoring is consistently worse than morning scoring (greens get firmer, pins get more accessible-by-luck rather than skill, players are more nervous about specific recovery shots). The actual cut line drifts a half-shot to a full shot higher than projected by Friday lunch.
Globally, the R&A’s data shows 108 million people engage with golf in some form, of whom 43.3 million play 9 or 18 holes on a course. The US Open’s audience is a subset of that population that pays attention to the hardest test of the year — and the live betting volumes during US Open week reflect that focused attention.
Historic Pricing Collapses Worth Knowing
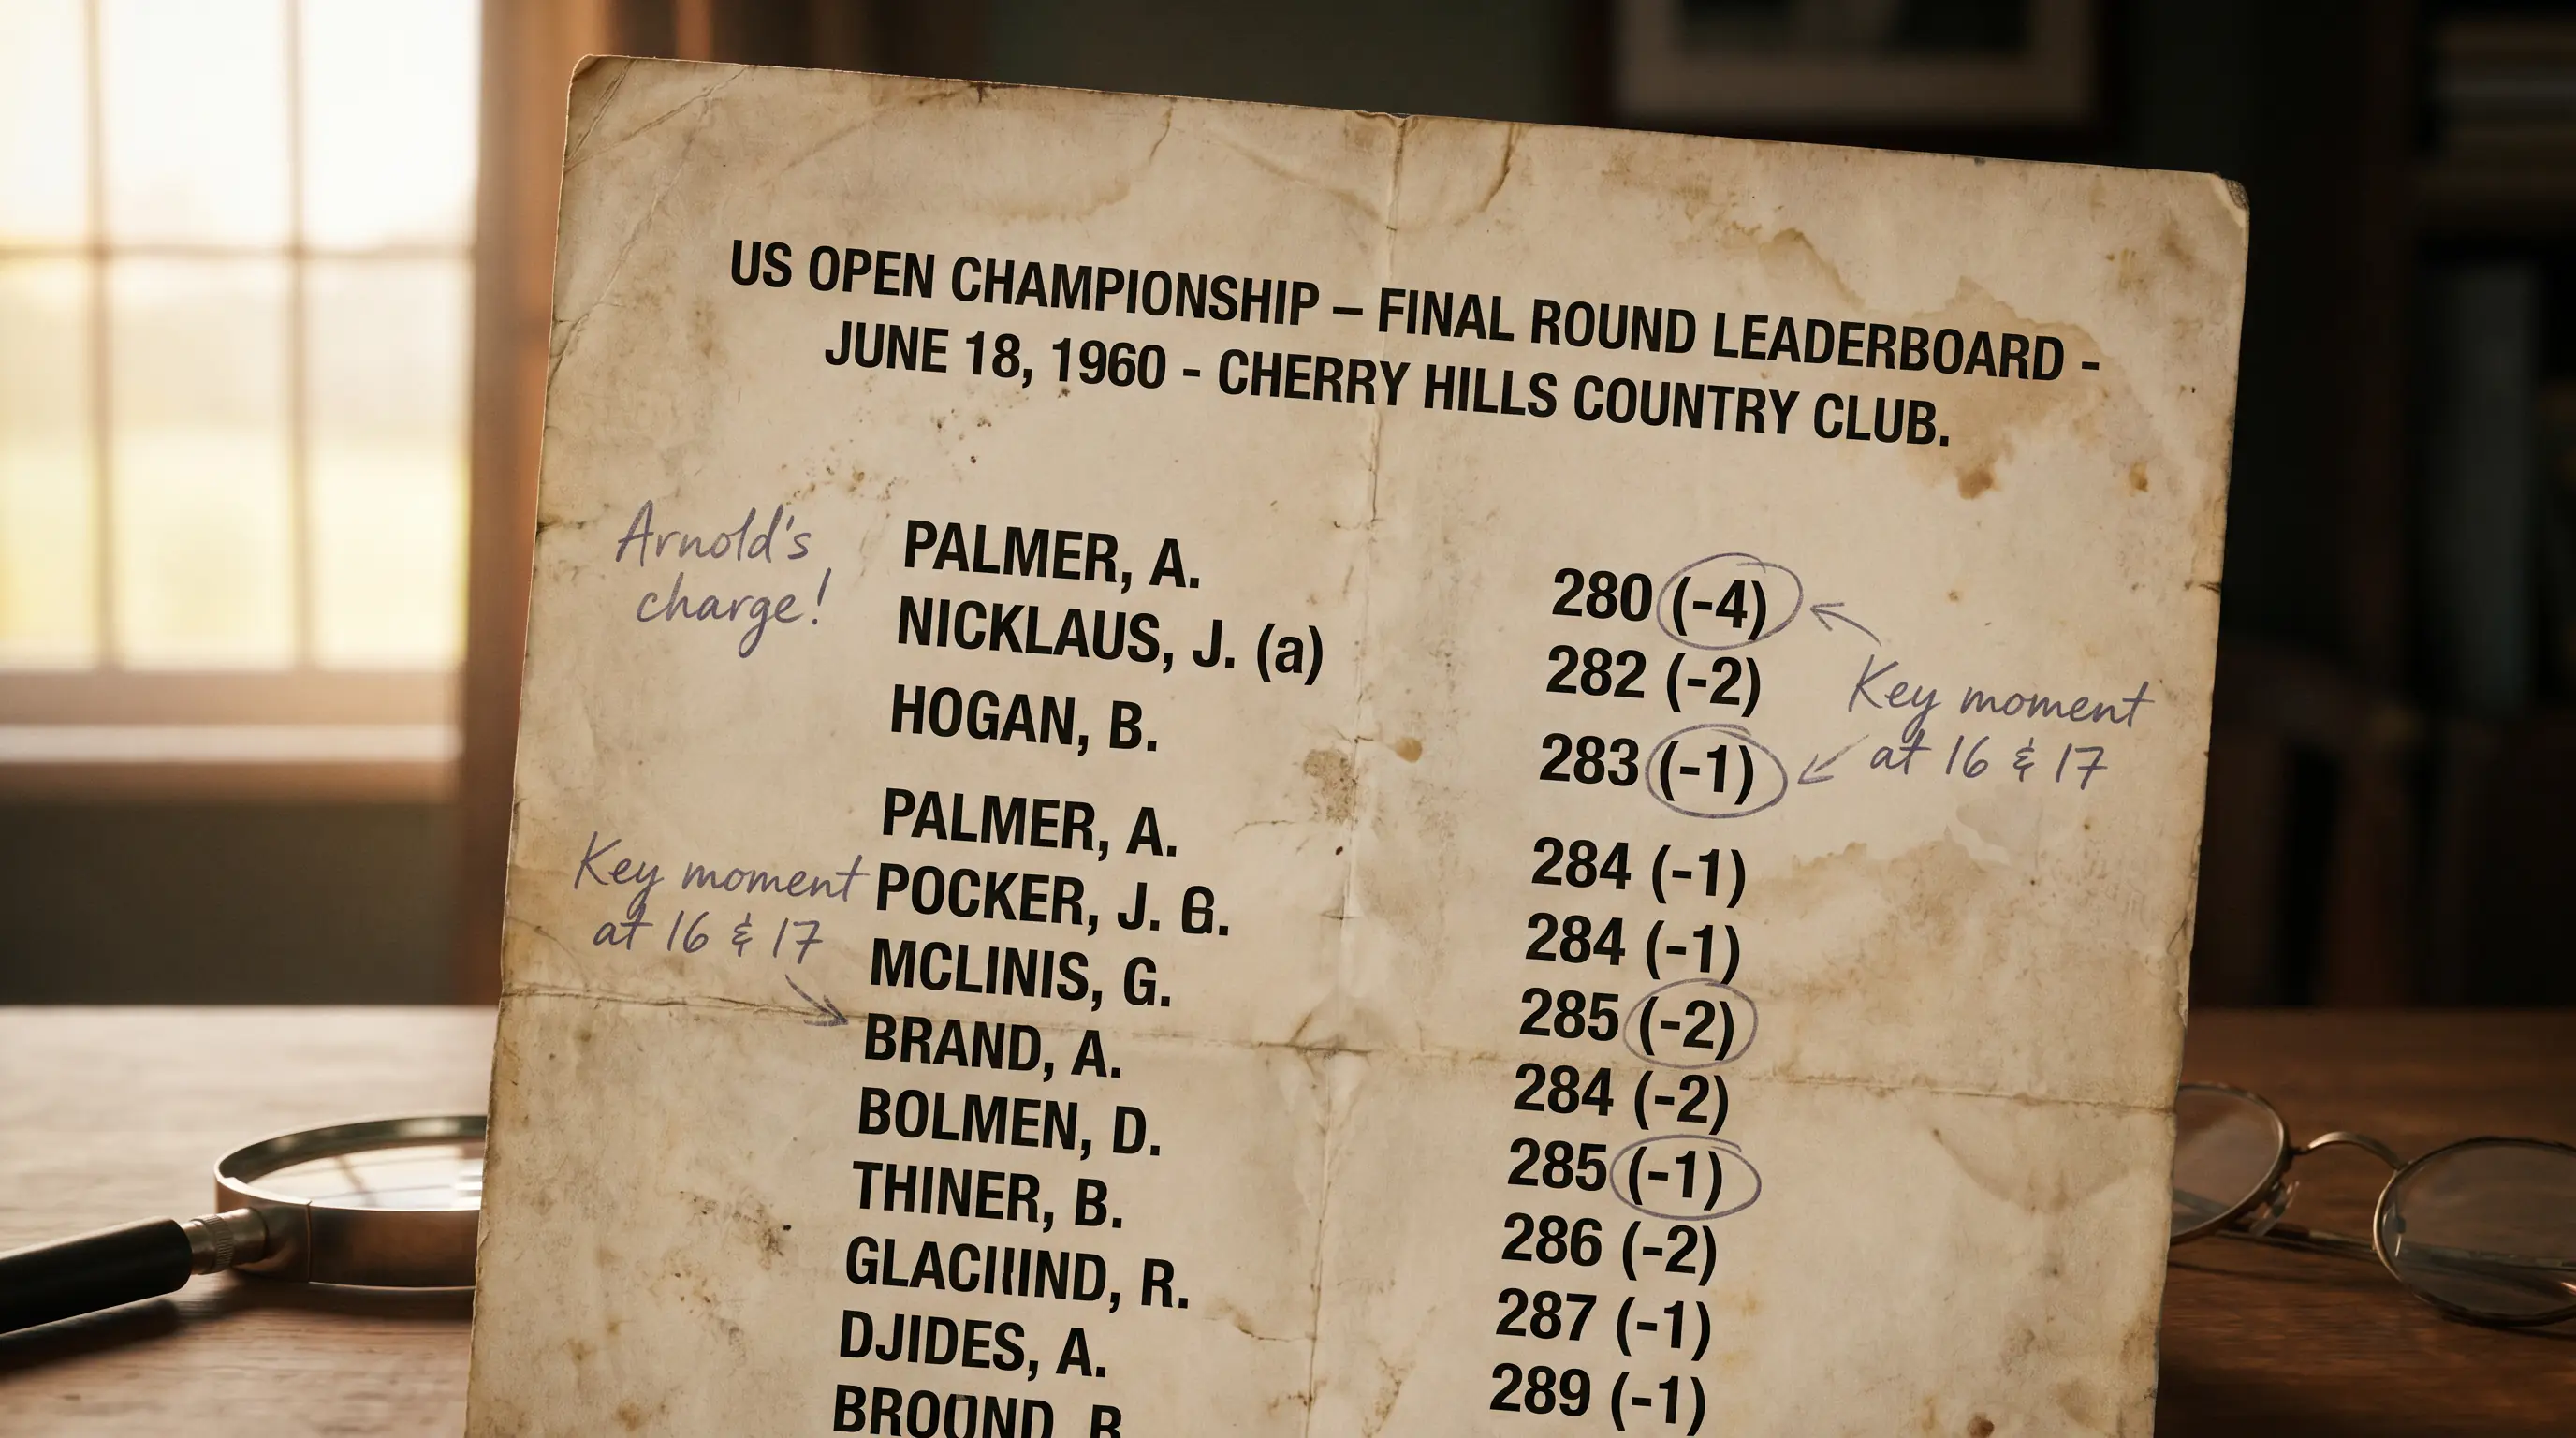
The US Open produces price-collapse moments more frequently than any other major because the setup punishes one bad swing more severely. Phil Mickelson at Winged Foot in 2006 (double bogey on 18 to lose) is the historical archetype. Dustin Johnson’s collapse at Chambers Bay in 2015 has similar character.
The recurring pattern: a player priced at 1.30 decimal or shorter on Sunday’s back nine experiences a single hole disaster (out-of-bounds drive, lost ball in rough, three-putt from off the green), and the price snaps from 1.30 to 8.00 within a single hole. The opposite player — the one chasing into the gap — sees a corresponding price contraction.
Live punters can rarely catch these moments at value because the market suspends during the disaster shot and reopens after the player has signed the score. The post-disaster price already reflects the new reality. The opportunity, where it exists, is in the pre-disaster moment when a player on the cut line of “1.30 implied 77 per cent” is statistically more like 65-70 per cent likely to close out the round cleanly under US Open conditions.
The actionable read from recent US Opens: be suspicious of any live front-runner priced shorter than 1.40 decimal on Sunday before they have completed at least 13 holes. The variance of US Open scoring on the closing five holes regularly produces 4-shot swings, and the 1.40-or-shorter price does not capture that probability honestly.
Why does an even-par leader at the US Open often hold longer odds than expected?
Because the betting public anchors on what a leader looks like at normal tour events, where the winner is usually at -15 or better. A US Open leader at -2 looks ‘not really leading’ to casual punters, and the price drifts longer than the implied probability genuinely warrants. The model corrects this, but the correction is incomplete before public-side money rebalances.
How does USGA’s rough-prep schedule shift Friday live odds?
The USGA’s grounds team typically lets the rough grow through Thursday and Friday, with the most severe setup conditions emerging during Friday afternoon. The shift produces a small but consistent late-Friday scoring deterioration that the live MTC market does not always price efficiently, with borderline cut-line players’ MTC prices systematically too short by lunch on Friday.
