

 Available in US
Content
The Major Most People Underrate for Live Trading
The PGA Championship is the major I get asked about the least and trade the most efficiently. The Open is the home major UK punters obsess over. The Masters is the spectacle. The US Open is the test. The PGA, sitting in May without the cultural baggage of the other three, gets read as “the data major” by the punters who actually trade it well, and that is how I treat it too.

The PGA tour broadcasts on CBS during the 2025 regular season averaged 2.16 million viewers for the final round, up 21 per cent on 2024. That mainstream audience matters because the PGA Championship runs through CBS and Sky in the UK, and the trading liquidity in May reflects an audience that is genuinely engaged but less reactive than the audiences for the more emotionally weighted events. The result is a major where the live prices tend to follow the model rather than chasing public-side sentiment.
What follows is what makes the PGA’s venue rotation matter for live betting, why the field depth differs from the other majors, where the leaderboard volatility lives, and which props are actually available during the event.
Venue Rotation and the Bias It Creates
The PGA Championship rotates through venues selected by the PGA of America, not by a fixed historic site like the Masters or by a single regional setup philosophy like the US Open. The rotation in recent and upcoming years has included Quail Hollow, Southern Hills, Oak Hill, Valhalla, and others — generally classic American parkland courses with par-72 setups, fairway widths approaching tour standard, and rough thicknesses that fall between Masters and US Open levels.
The implication for live betting is that PGA venues are statistically closer to “regular tour course” than any other major’s setup. The standard SG-based models work better at the PGA than they do at the Masters or US Open, because the scoring conditions are within the same distribution as recent tour events.
The variance the venue rotation introduces is course-specific. Quail Hollow’s par-5s reward long iron play in ways that Southern Hills’ par-5s do not. Valhalla’s greens are firmer than Oak Hill’s. The model has to adjust for venue, but the adjustments are smaller and more reliable than at the Masters (single-venue specialism) or at links events.

The pre-tournament price discovery at the PGA tends to be more efficient than at other majors precisely because the venue is more model-able. The mid-tier value that exists at Augusta’s idiosyncrasies tends not to exist at most PGA venues — players at 60/1 to 100/1 are usually priced at those numbers because they are statistically priced there, not because the public has under-considered them.
Field Depth vs Other Majors
The PGA Championship’s field is the deepest of the four majors. The standard PGA field is 156 players including 20 PGA of America club professionals, against The Open’s 156 (a similar mix of qualifiers and exempt names), the US Open’s 156 (with a similar qualifier proportion), and the Masters’ 95 (the smallest major field by a large margin).

The structural difference is the strength concentration. The Masters’ 95-player field is essentially the top 95 ball-strikers in world golf with a handful of past-champion exemptions. The PGA’s 156-player field includes the top 99 from the OWGR, then 20 PGA club pros (who in most years finish in the bottom 30 of the leaderboard), then a mix of past-champion and discretionary invitees.
For live betting, the deeper field changes the top-finish maths. Top-10 finishes at the PGA require beating roughly 145 players actually capable of winning, against roughly 85 at the Masters. The implied probabilities adjust accordingly — a 30/1 outright at the PGA carries roughly the same top-10 implied probability as a 25/1 outright at the Masters because the competitive pool depth is greater.
The 2025 PGA Tour driving-distance average sat at 303 to 304 yards, with leaders like Aldrich Potgieter pushing 327+ and the tour average growing 5-7 yards year on year. This driving-distance edge in modern fields matters at PGA venues that favour distance — Quail Hollow specifically rewards 310+ yard tee shots — and the model weighting at distance-rewarding PGA venues should pull more on driving-distance metrics than the season-long average suggests.
Live Leaderboard Volatility
The PGA Championship’s leaderboard volatility through the four rounds is intermediate between the Masters’ Sunday-back-nine extremes and the US Open’s grinding survival narrative. PGA scoring runs typical for a tour event with major-level pressure: winning scores between -10 and -18 in most years, cut lines around +2 or +3, weekend leaders typically clustering within four shots of each other.
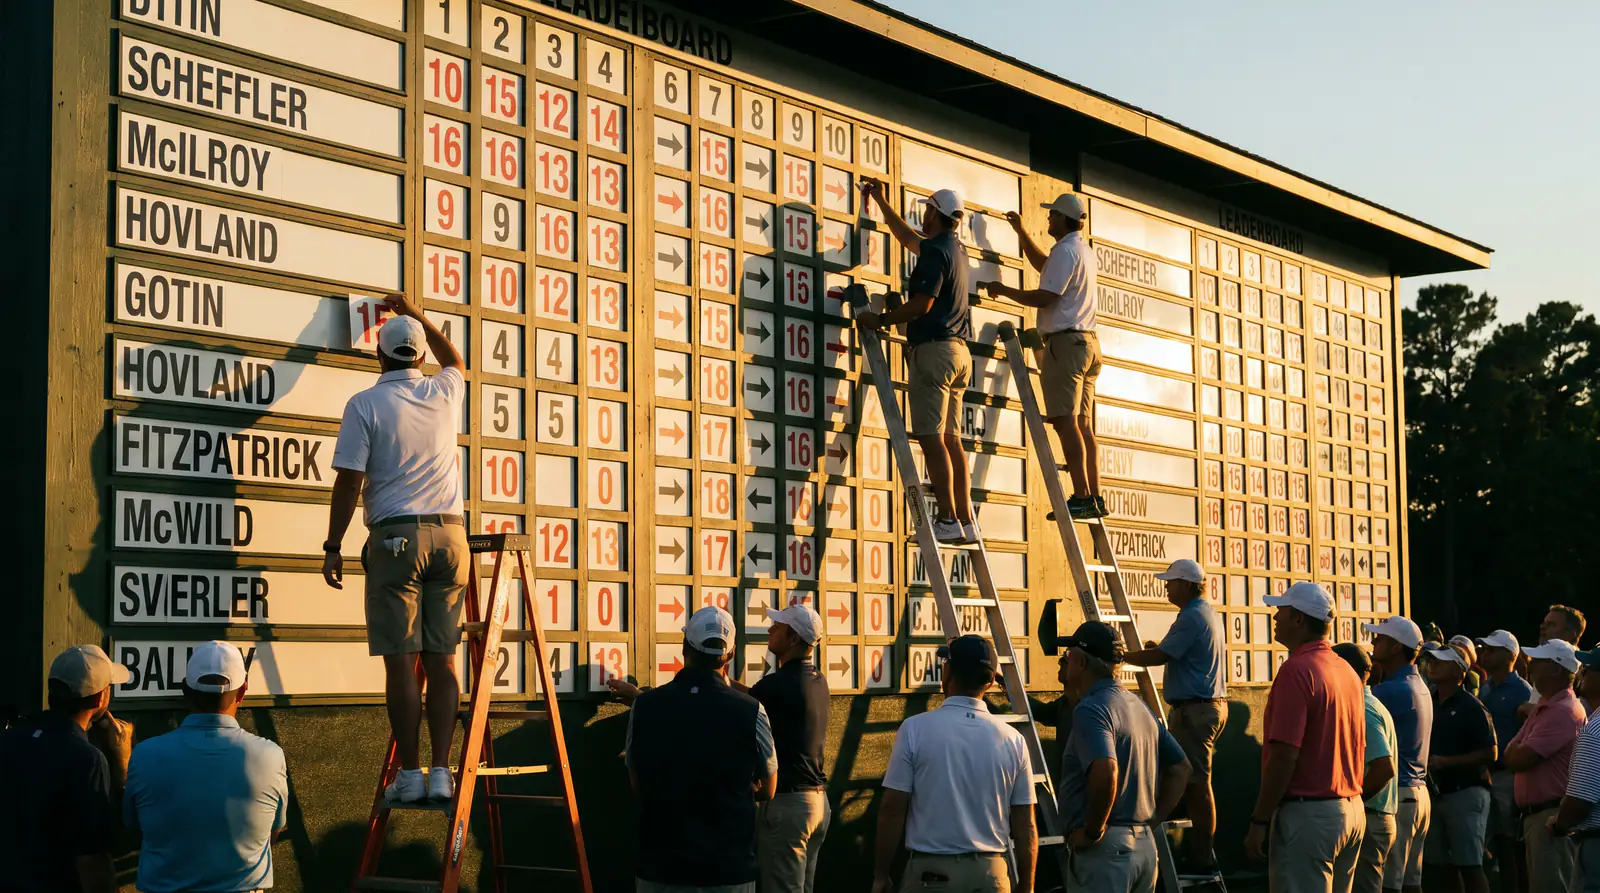
The action profile at majors is consistent across recent years. Halvor Egeland, trading manager at BetMGM, noted ahead of the 2025 Ryder Cup that “Scottie Scheffler and Rory McIlroy are taking the most action on top points scorer, to no surprise.” The same dynamic plays out at the PGA: the top 2-3 names attract 50-65 per cent of the outright public-side money even when the model says the field is genuinely deeper, and the live prices reflect this concentration through Sunday.
The volatility pattern at the PGA tends to be Saturday-driven rather than Sunday-driven. Friday’s cut and Saturday’s “moving day” scoring produces most of the meaningful live-price shifts, with Sunday typically a clear two-or-three-horse race for the title. Live entries in the Saturday afternoon window (3 pm to 6 pm UK time) regularly capture better value than Sunday entries, because the Sunday board has often firmed up by the time the European audience tunes in.
The trading desks’ models perform better at the PGA than at the other three majors because the scoring distribution is closer to season-long norms. The live prices respond more predictably to single shots, single holes, single rounds. The discipline reward is higher because the read-to-price mapping is more reliable.
Prop and Special Availability During the Event
The PGA Championship attracts roughly the same live prop coverage as The Open at most major UK operators: outright, top-5/10/20, head-to-head matchups, three-balls, FRL and LAR markets, hole-in-one specials on the par-3s, and bet-builder construction across multiple legs.

What is less commonly available at the PGA than at other majors: live streaming inside the operator app (the rights deals tend to favour the Masters and The Open over the PGA), live “next hole” props on specific holes (the model’s confidence is lower at less-covered venues), and Race-to-Dubai or FedEx Cup standings overlay markets (these typically appear only at the year-end championship events).
Is the PGA Championship the most data-driven major for live betting? In my notebook, yes. The combination of typical-tour scoring distribution, deep field, mainstream broadcast coverage, and venue rotation through model-able parkland courses produces a market where the data reads convert into pricing more reliably than at any other major.
The May calendar position adds a specific liquidity wrinkle. Live volumes in May trail the April Masters by 25-35 per cent at most UK operators, and trail The Open in July by 40-50 per cent. The lower volume means slightly wider spreads on niche markets (specific-hole props, mid-tier head-to-heads) and slightly narrower spreads on top-of-board markets (outright, top-5). For punters trading the headline markets, the PGA’s quieter calendar is an advantage.
Is the PGA Championship the most data-driven major for live betting?
In practice, yes. The PGA’s scoring distribution is closer to a typical PGA Tour event than the other three majors, the field is the deepest, the venue rotation produces model-able parkland setups, and the trading-desk models perform more predictably. The data-to-pricing mapping is more reliable than at the Masters, US Open, or Open.
How does the May calendar position influence live-odds liquidity?
Live betting volumes at the PGA trail the Masters by 25-35 per cent and trail The Open by 40-50 per cent at most UK operators. The lower volume produces slightly wider spreads on niche markets and slightly narrower spreads on top-of-board markets. The May position is a structural advantage for punters trading the headline outright and top-finish markets.
